
OEE in Manufacturing: Meaning, Formula, and How to Improve Overall Equipment Effectiveness
On the factory place, you find that the main machine used for packaging has stopped running suddenly. Due to this, the production line freeze, operators are standing without work, and the daily production target is slowing down.
You need to call the maintenance crew to resolve the issue. But after the repair, your production manager asks a critical question: How much did this breakdown actually cost us in terms of efficiency, and how many defective items were produced before it stopped? This simple step of measuring how well a manufacturing operation is utilized is where OEE comes in.
OEE or Overall Equipment Effectiveness manufacturing metrics are an important part of daily operation in modern factories. All the companies, including a heavy manufacturing plant, food processing factory, or electronics assembly line, mainly relies on equipment efficiency to resolve the production constraints and run the work smoothly.
A fully organized real time production monitoring system makes sure that every stop, slowdown, and defect is recorded and addressed in a timely manner. Without this, crucial production data can be lost, forgotten, or poorly managed.
From this article, we will cover:
- What does OEE stand for and its meaning
- How to calculate OEE overall equipment effectiveness
- The three components of OEE
- Typical manual calculation challenges
- How OEE tracking software makes the process easier
- Best practices to improve overall equipment effectiveness
At the end, you will understand why companies are utilizing digital OEE dashboards instead of spreadsheets and whiteboards to track their factory floor.
What Does OEE Stand For?
When people ask, what is OEE in production? it stands for Overall Equipment Effectiveness.
It is a standard process used in manufacturing to find out the effectiveness of a machine or equipment being used during the estimated production time.
In short, OEE tells you what percentage of your manufacturing time is really productive. If a machine runs for the whole day but produces faulty products, or stops frequently for no reasons, then the OEE score will be low, even if the machine appeared to be working well.
So, it is the combination of three factors, how available the machine is, how fast it performs, and how good the output quality is. Consolidating these three factors gives a complete picture of equipment effectiveness.
An OEE score of 100% means you are manufacturing only good parts, as fast as possible, with no stop time. In general, plant managers look at OEE overall equipment effectiveness to identify where they are losing time and money whether due to machine breakdowns, slow running speeds, or poor product quality.
InnoMaint uses digital tools to capture these machine states so that it ensures every production loss is properly documented and tracked from start to end.
OEE Meaning vs Equipment Effectiveness
Majority of the time, we confuse the general equipment effectiveness with OEE overall equipment effectiveness. While both refer to how well an equipment funcions, OEE is a specific, calculated measure with a simple formula that brings together three separate performance indicators into a single score.
The effectiveness of General equipment may refer only to machine performance, but OEE calculation gives you an actual number that can be tracked, compared, and improved gradually.
How to Calculate OEE Overall Equipment Effectiveness
Although people usually use basic production numbers, the formula for OEE requires a specific mathematical approach to give a true picture of equipment effectiveness.
OEE Calculation Formula The most straightforward overall equipment effectiveness formula is calculating the ratio of Fully Productive Time to Planned Production Time. However, the industry standard OEE calculation is:
OEE = Availability × Performance × Quality
OEE Calculation Example Let’s look at a practical example to understand the calculation:
- Availability:The machine ran for 7 hours out of an 8-hour shift. We can divide 7 by 8, so the score is 87.5%.
- Performance:If 700 parts are produced in a machine, but it can ideally produce 1000 parts in that 7 hours. Divide 700 by 1000 is equal to 70%.
- Quality:Total parts produced is 700, from that 665 were good, and 35 were faulty. Divide 665 by 700 and is equal to 95%.
You will get the final score by multiplying the percentages: 0.875 * 0.70 * 0.95 = 0.581. So the OEE score is 58.1%.
The Three Components of OEE
1. OEE Availability
Availability considers all events that stop planned production long enough where it makes sense to track a reason for it (typically several minutes). This includes equipment failures, material shortages, and changeover time. An 8 hour shift is scheduled for a machine to run, but it breaks down for an hour, this is where OEE availability drops.
2. OEE Performance Calculation
OEE performance tells you how fast the machine is running compared to the speed it could run at its maximum capacity. Even though the machine runs without stopping, it could still be running slower than the ideal speed. This still gives a less in output.
The equation for performance is:
Performance = (Ideal Cycle Time × Total Count) ÷ Run Time × 100
The performance score will show that the machine is only running at 80% of its ideal speed because of small stops or slow cycles.
3. OEE Quality
OEE quality considers the percentage of total manufactured parts produced which meet the required quality standards. It also accounts for all the defective parts, rejected parts and rework that does not pass inspection. It compares the number of good parts produced to the total parts produced. If out of 100 parts, 5 are defective, your OEE quality is impacted.
Out of 1,000 parts produced if 50 are defective, the quality score is 95%.
Types of OEE Metrics Manufacturing Teams Track
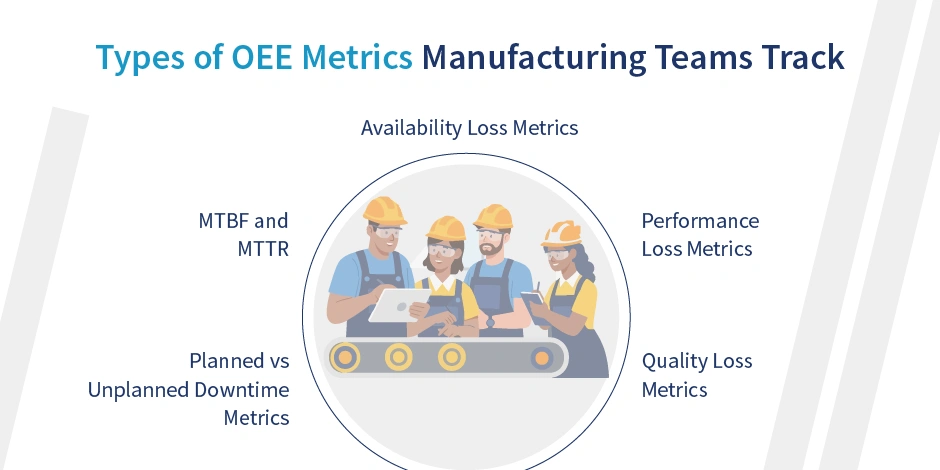
Not all losses on the production floor look the same. Some machines break down completely, some slow down quietly, and some produce parts that simply cannot pass quality checks. The manufacturing teams tracks the various types of OEE metrics so that they can view exactly where the problem is coming from and handle it in right way.
1. Availability Loss Metrics
This captures everything that hinders a machine from running when it is supposed to be running. Unexpected breakdowns, equipment failures, and changeover delays will fall under this category. Every minute the machine stays idle during planned production time will pull the OEE availability score to down.
2. Performance Loss Metrics
Sometimes a machine runs without stopping but still does not produce as much as it should. That is a performance loss. Slow cycles, minor jams, and small interruptions throughout the shift add up quickly. These are the kinds of losses that are easy to overlook but show up clearly in the OEE performance calculation.
3. Quality Loss Metrics
Producing parts is one thing — producing good parts is another. Quality loss metrics track how many parts come out defective or need rework. Whether the rejects happen during startup or mid-production, all of them affect the OEE quality score and ultimately the overall OEE number.
4. Planned vs Unplanned Downtime Metrics
There is a big difference between stopping a machine for scheduled maintenance and a machine stopping on its own without warning. Manufacturing teams monitor this ratio closely. When unplanned downtime starts climbing, it is usually a sign that the preventive maintenance program needs attention — and OEE availability takes the hit.
5. MTBF and MTTR
Mean Time Between Failures and Mean Time to Repair are two supporting metrics that give more context to the availability numbers. How often does this machine fail? And when it does, how long does it take to get it back up? These two questions together tell a lot about how reliable a piece of equipment really is.
Challenges of Tracking OEE Manually
Many factories still rely on clipboards, Excel sheets, and shift-end reports to track production performance. It works — until it does not. And for most manufacturing teams, the cracks start showing sooner than expected.
Inaccurate Data: Manual entry is only as good as the person filling it in. Operators under pressure at the end of a shift are likely to estimate, round off, or simply forget what happened two hours ago. The OEE score you get from that data is not really your OEE score.
Delayed Reporting: By the time someone compiles the data, runs the numbers, and puts together a report, the production run is long over. Managers are always looking at yesterday's problems, not today’s.
No Real-Time Visibility: If something goes wrong on the floor right now, a spreadsheet cannot tell you that. Without a real time production monitoring system in place, the only way to know what is happening is to physically walk over and check.
Difficulty in Identifying Root Causes: A low OEE score in a spreadsheet tells you something is wrong. It does not tell you where. Was it a downtime issue? A speed problem? A quality defect? Digging through manual records to find the answer takes time that most teams do not have.
Inconsistency Across Shifts: One operator records a 10-minute stoppage. Another one on the next shift ignores it because it seemed minor. Over time, this inconsistency makes it nearly impossible to do any meaningful comparison between shifts or production lines.
How OEE Software Automates Overall Equipment Effectiveness Tracking
This is where things change significantly. A good OEE monitoring software or production monitoring software takes the entire process, data collection, calculation, reporting — and handles it automatically, without waiting for anyone to fill in a form.
Automated OEE Data Collection
OEE tracking software connects to machines through sensors or PLCs and pulls production data continuously. Availability, performance, and quality numbers are captured in real time, accurately, and without anyone having to do it manually.
Real Time Production Monitoring
Managers and supervisors can see exactly what is happening on the floor at any moment. Which machines are running, which have stopped, and what the OEE score looks like for each line — all of it is visible in real time through the production monitoring software.
OEE Dashboard Software
Instead of digging through rows of data, the OEE dashboard software displays everything visually — charts, trends, comparisons between shifts, and alerts when something drops below target. It makes the information easy to act on, not just easy to look at.
Automatic OEE Calculation
The system runs the OEE calculation formula in the background continuously. There is no manual calculation, no formula errors, and no end-of-day scramble to put numbers together. The OEE score is always current and always accurate.
Overall Equipment Effectiveness Calculator
Some OEE platforms also include a built-in overall equipment effectiveness calculator that lets teams run scenarios. If availability improves by 5%, what happens to the overall OEE score? These simulations help teams make better decisions about where to focus their improvement efforts.
Root Cause Analysis and Reporting
Every downtime event, speed loss, and quality rejection is logged with a timestamp. When something goes wrong, the data is already there — sorted, searchable, and ready for the maintenance or production team to investigate without guessing.
InnoMaint gives manufacturers a complete OEE monitoring and production tracking setup that connects with existing equipment and brings real-time insights straight to the people who need them most.
OEE Monitoring Software Advantages
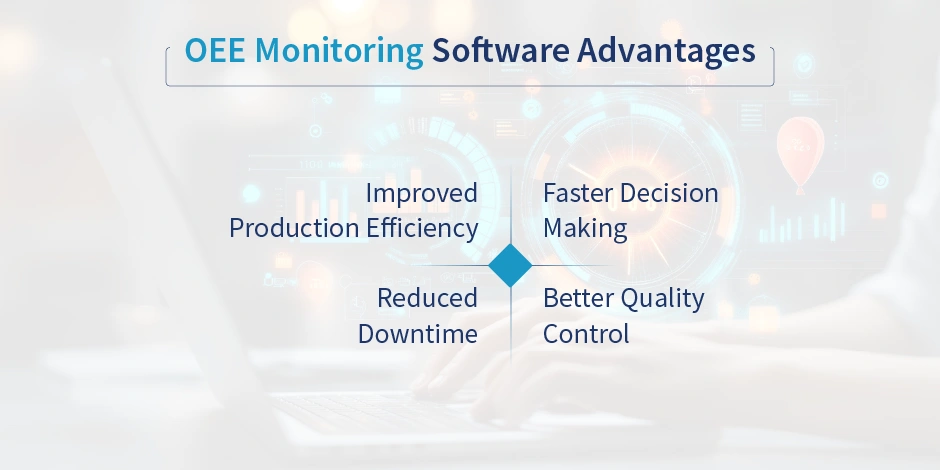
Shifting from manual tracking to modern digital OEE software is not just about convenience, it changes how the entire production team operates.
Improved Production Efficiency: You can fix the losses when they are visible and measured. Manufacturers who actively monitor OEE can find and remove the hidden inefficiencies that manual methods would have never found.
Faster Decision Making: With the real-time data on the OEE dashboard software, the managers do not have to wait until the shift ends to act on the problem or issue. If something is going wrong, they know it while there is still time to do something about it.
Reduced Downtime: Tracking the OEE availability continuously gives early signs of equipment trouble that show up before things break down completely. That gives maintenance teams a chance to step in before a breakdown occurs and hinders the entire production schedule.
Better Quality Control: OEE quality data marks directly to the machines or processes generating the most defects. Rather than chasing symptoms, teams can fix the actual source of the problem.
Best Ways to Improve Overall Equipment Effectiveness
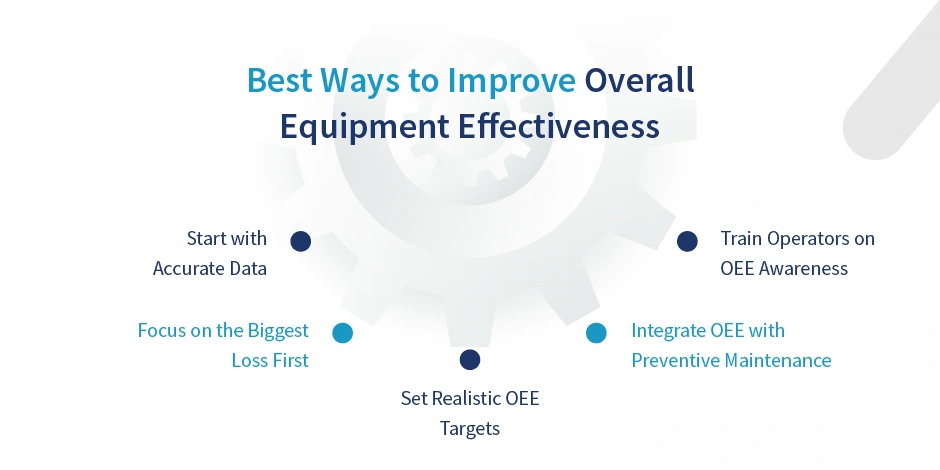
Improving OEE is not a one-time achievement, it is an ongoing thing. Here are some practical steps that companies like InnoMaint recommend to manufacturing teams looking to raise their scores.
Start with Accurate Data: Everything depends on the quality of the data going in. Before one should chase the improvement targets, make sure the numbers being captured through the OEE tracking software are reliable.
Focus on the Biggest Loss First: When you look at the OEE breakdown, try to find out whether availability, performance, or quality is causing the most damage. Fixing everything at once is impossible so start where the impact is highest.
Set Realistic OEE Targets: Jumping all the way to 85% OEE when the current score is 55% is not a plan, it is a wish. Set small and achievable milestones for each shift and line, and then build momentum from there.
Integrate OEE with Preventive Maintenance: Most of availability losses comes from equipment that was not maintained on time. Connecting OEE data with a CMMS helps teams schedule maintenance before failures happen, not after.
Train Operators on OEE Awareness: When operators understand that a slow cycle or a small jam actually shows up in the numbers, they are far more likely to report it right away instead of letting it slide.
End Thoughts
We know that every improvement in manufacturing starts with understanding how well your equipment is truly performing. Overall Equipment Effectiveness gives manufacturers a clear and measurable way to identify hidden losses and take the right corrective actions.
However, tracking OEE manually through spreadsheets or paper logs becomes too clumsy and the results have become poor in accuracy, disorganized, and leading to delays in response.
InnoMaint has started streamlining the OEE tracking process using modern tools like OEE monitoring software and real time production monitoring systems that automate the data collection, OEE calculation, and reporting — from the production floor all the way to the management dashboard.
It simplifies the measurement of overall equipment effectiveness and maintains the reliability of production assets by utilizing digital solutions like OEE dashboard software and OEE tracking software.
An essential OEE monitoring system is needed to sustain productivity, equipment effectiveness, and operational excellence in this competitive and fast-moving manufacturing environment.
Frequently Asked Questions
OEE stands for Overall Equipment Effectiveness. It is a standard metric used in manufacturing to measure how productively a machine or equipment is being used during its planned production time. It considers three factors — availability, performance, and quality and combines them into a single percentage score.
A perfect OEE score is 100%, but that is rarely achievable in real production environments. In practice, a score of 85% is considered world-class. Most manufacturers operate somewhere between 60% and 75%, and anything below 60% is usually a sign that there are significant losses in availability, performance, or quality that need to be addressed.
The OEE calculation formula is: OEE = Availability × Performance × Quality
Each of the three components is calculated as a percentage and then multiplied together to give the final OEE score. For example, if availability is 90%, performance is 86%, and quality is 94%, the OEE score would be approximately 73%.
The three components of OEE are:
- OEE Availability— measures how much of the planned production time the machine was actually running
- OEE Performance— measures how fast the machine ran compared to its ideal speed
- OEE Quality— measures the percentage of total parts produced that met quality standards without rework or rejection
All three must be strong for the overall OEE score to be high.
A maintenance request is a report submitted when something goes wrong with equipment or infrastructure. OEE, on the other hand, is a performance metric that tells you how effectively your equipment is being used overall. In simple words, a maintenance request reacts to a problem, OEE helps you spot the problem before it gets worse.
Here is a simple OEE calculation example:
- Planned Production Time: 450 minutes
- Unplanned Downtime: 45 minutes → Run Time: 405 minutes
- Ideal Cycle Time: 1 minute per part
- Total Parts Produced: 350
- Good Parts: 330
Availability = (405 ÷ 450) × 100 = 90% Performance = (350 ÷ 405) × 100 = 86.4% Quality = (330 ÷ 350) × 100 = 94.3% OEE = 90% × 86.4% × 94.3% = 73.3%
This example shows how even a well-running machine can have a lower OEE score because of small losses in all three areas.
OEE in production helps manufacturers identify where time and resources are being wasted, whether it is due to machine breakdowns, slow running speeds, or quality defects. Without OEE tracking, these losses often go unnoticed. With it, production teams can take targeted actions to improve efficiency, reduce downtime, and increase output without adding new equipment or extra shifts..
Yes. Many OEE software platforms can integrate with a CMMS Computerized Maintenance Management System. This connection helps manufacturers link equipment performance data with their preventive maintenance schedules. When OEE availability drops or a machine shows signs of wear, the system can automatically trigger a maintenance request, reducing the chance of an unexpected breakdown and improving the overall equipment effectiveness over time.
The most common reasons for a low OEE score include:
- Frequent unplanned machine breakdowns that reduce availability
- Machines running slower than their ideal speed due to minor stops or worn parts
- High defect or rejection rates caused by process issues or operator errors
- Long changeover times between production runs
- Poor preventive maintenance planning leading to repeated failures
Identifying which of these three areas: availability, performance, or quality, is causing the biggest drop is the first step to improving OEE.
OEE was originally developed for manufacturing environments, but today it is also used in industries like food processing, pharmaceuticals, logistics, and facility management. Any industry that relies on equipment or machinery to produce output can benefit from tracking overall equipment effectiveness and using OEE metrics to identify and eliminate production losses.